
Click here to get my help with this implementation
Are you ready to monitor your LAN with PRTG Network Monitor and PRTG Hosted Monitor? When you install PRTG, you’ll get the best of both worlds – the local probe and hosted probe. The local probe runs on the PRTG core server system and monitors all reachable devices, servers, and services from the system. And with the hosted probe, you can monitor targets that are publicly available via the internet. Get ready to experience the power of PRTG!
When is a PRTG Network Monitor remote probe required?
Are you looking for a way to keep track of your local network or multiple locations? do you need to monitor services across firewalls or secure networks? or perhaps you want to do packet sniffing on a different computer? with prtg hosted monitor and remote probes, you can do all of these tasks and more! monitor your network with confidence and get the most out of your PRTG installation by doing things like;
▪To monitor your local network.
▪To make sure that services are available from all your organization locations.
▪Monitoring Locally Segmented Networks because the local probe cannot monitor specific services across these firewalls.
▪To monitor systems in a secure environment and you need a secured transport between the PRTG core server and that network.
▪You want to sniff packets or/and want to monitor NetFlow data on a different computer.
▪If there are CPU-intensive sensors like Packet Sniffer or NetFlow sensors and need to load balance among more than one computer.
Click here to download PRTG Network Monitor Tool
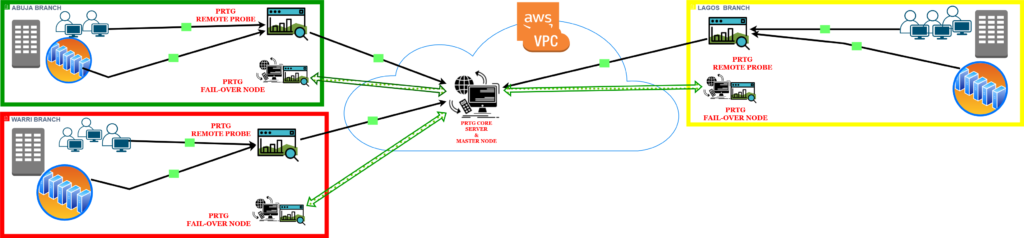
Picture Below shows an example of a PRTG Network Monitor remote probe scenario.
How Probes Work
A probe instantly establishes a connection to the PRTG core server as soon as it starts, downloads the sensor configuration, and starts performing its monitoring duties. As soon as a user modifies the monitoring settings, the PRTG core server transmits updated configuration data to a probe. For each check they do, probes monitor independently and relay the monitoring data back to the PRTG core server.
The probe keeps monitoring and records the findings even if the connections between the PRTG core server and a probe break down for any reason (for instance, while restarting the PRTG core server system). A buffer retains up to 500,000 sensor results in the RAM of the remote probe system during a loss of connection (up to 50 – 200 MB). As a result, for the loss of a connection occurring. This shows that the probe can store monitoring data for 100 sensors with a one-minute scanning interval for up to three days (or 52 minutes for 10,000 sensors with a scanning interval of one minute). The probe immediately re-connects to the PRTG core server as soon as it becomes available again and sends all monitoring data it collected throughout the connection break.
Securing Probe Connections with SSL/TLS in PRTG
The Secure Sockets Layer/Transport Layer Security (SSL/TLS) connection between a probe and the PRTG core server is initiated by the probe. This ensures that data transmitted between the probe and the PRTG core server remains invisible to anyone recording data packets. In order to receive probes, the PRTG core server opens a TCP/IP port and watches for probes to attempt to connect.
When a brand-new probe connects for the first time, you receive a ToDo ticket and see the new probe in the device tree.
Manual Probe Approval and Connection Security in PRTG
As a security precaution, you must manually approve the probe in the device tree before you may create any sensors.
You can also refuse a test. After that, PRTG disconnects it. The system removes the probe’s IP address from the Deny IP Addresses list in the probe’s system settings, rejecting all subsequent connection attempts. As a result, unauthorized probes will be unable to connect to a PRTG core server. Since the probe initiates the connection, you need to allow it to connect from the outside to your PRTG core server.
The approach is the same as allowing access to the PRTG web server via the PRTG core server’s ports 80 or 443. Typically, this requires an enable or allow-NAT (Network Address Translation) rule to let the probe connect to the PRTG core server through TCP port 23560. The probe then uses an incoming connection through a dynamic port in the high port range (49152 – 65535).
If PRTG is running in a cluster, remote probes connect to all cluster nodes and deliver monitoring data. This works as mentioned above for a single PRTG core server. In the event that the expert hub fails, you can still see observing data on the failover hubs. Cluster Connectivity for each probe can be configured under the Administrative Probe Settings section of the probe’s settings.
How PRTG network monitor tool updates probe automatically
When a new version of PRTG is installed on the PRTG core server, all remote probes download and install the latest version as soon as they reconnect to the updated PRTG core server.
When you update the PRTG core server, PRTG updates the local probe. All remote probes download the new binaries automatically via the SSL/TLS-secured probe connection or the PRTG core server connection. Depending on the available speed, downloading the 4-MB file can take anywhere from a few seconds (on LANs) to a few minutes (through internet connections). The remote probe disconnects install the update and reconnect to the PRTG core server as soon as it is downloaded. This takes anywhere from 20 to 100 seconds. It should be noted that throughout the update phase, monitoring by the local probe can be affected because of the bandwidth that is required for the downloads.
If a remote probe keeps disconnecting after an update, check if the server with the remote probe has two network connections with different IP addresses. Make sure that these addresses are in the list of allowed IP addresses in the Core & Probes settings.How to Delete PRTG network monitor Probe
When you delete a connected remote probe from the device tree, PRTG stops the probe service on the remote probe system and sets its startup type to manual. We also recommend that you delete the remote probe from the remote probe system.
When you delete a disconnected remote probe, the PRTG probe service on the remote probe system does not cease and has no effect on the starting type. Until you manually disable the PRTG probe service or uninstall the remote probe from the remote probe system, the remote probe will attempt to reconnect to the PRTG core server.